Most business owners know their website is working — or not working — based on gut feeling. The phone rings, or it doesn’t. The inbox has inquiries, or it’s quiet. But gut feelings don’t tell you why, and they certainly don’t help you make smart decisions about where to spend your marketing dollars.
That’s where conversion tracking comes in. When you know exactly how many people clicked your phone number, submitted a contact form, made a purchase, or downloaded your brochure — and when you can see all of that data in a single, clean dashboard — you stop guessing and start growing.
In this post, we’re going to walk through why tracking website conversions matters so much, what kinds of actions are worth measuring, and how tools like Google Analytics and Google Data Studio (Formerly Looker Studio) can be combined to give you a dashboard that shows you only what you actually care about — no data science degree required.

What Is a Conversion, Really?
In the world of digital marketing, a “conversion” is any meaningful action a visitor takes on your website. It’s the moment a browsing stranger becomes a potential customer — or better yet, an actual one.
Conversions aren’t one-size-fits-all. They depend entirely on your business model and goals. For a service-based business, a conversion might be someone filling out a contact form or clicking the phone number to call you. For an e-commerce store, it’s a completed purchase. For a contractor, it might be a request for a quote. For a restaurant, it could be a reservation booking or a click on directions.
Some of the most valuable conversion actions worth tracking for most small and mid-sized businesses include contact form submissions (every completed form is a real lead), phone number clicks (especially mobile taps directly on your number), completed online sales and transactions, appointment or reservation bookings, quote request submissions, and file or brochure downloads.
Each one of these is a signal. And when you collect enough signals over time, you start to see patterns that tell a story about your website, your marketing campaigns, and your customers’ behavior.
Why Tracking These Actions Matters So Much
 Let’s say you’re running two advertising campaigns — one on Google, one on Facebook — and spending $500 a month on each. Without conversion tracking, you might assume they’re both performing reasonably well because your website traffic has gone up overall. But traffic alone is a vanity metric. What actually matters is what that traffic does once it arrives.
With conversion tracking in place, you might discover that your Google campaign is driving 80% of your contact form submissions, while your Facebook campaign is generating clicks but almost no actual inquiries. That’s a $500/month decision you can make with confidence: reallocate, adjust creative, or cut. Without the data, you’d never know.
Businesses that don’t track conversions often continue spending money on marketing channels that aren’t generating results — simply because they have no way to prove otherwise. Conversion tracking gives you accountability for every dollar you spend online.
Conversion data also helps you understand your website’s user experience. If hundreds of people are visiting your contact page but very few are actually submitting the form, that’s a red flag — maybe the form is too long, too confusing, or broken on mobile. Data like this gives you the ability to diagnose and fix problems before they cost you real business.
Beyond advertising, conversion tracking informs decisions about your website content, calls to action, page layout, and even your service offerings. It’s the closest thing to a direct line of communication between your website visitors and your business strategy.
Google Analytics: The Foundation of Smart Tracking
 Google Analytics (specifically GA4, the current version) is the most widely used web analytics platform in the world — and for good reason. It’s free, powerful, and deeply integrated with other Google tools like Google Ads and Search Console.
At its core, Google Analytics tracks two categories of data: user behavior (how people move through your site) and events (specific actions they take). When set up properly, it can capture every conversion mentioned above — form submissions, phone clicks, purchases, bookings — and attach that data to a wealth of context: where the visitor came from, what device they used, which page they were on, how long they spent on the site, and much more.
Setting Up Conversion Events
Out of the box, GA4 tracks some basic engagement metrics automatically. But to capture the specific conversions that matter to your business, you’ll typically need to set up custom events — little pieces of code or configuration that tell Google Analytics “when someone does this, record it.”
The process generally looks like this:
- Define your conversions. Before touching any code, get clear on what actions matter most to your business. Contact form completions, phone number clicks, add-to-cart events, completed checkouts — list them out in order of priority.
- Use Google Tag Manager. Google Tag Manager (GTM) is a free tool that sits between your website and analytics platforms, making it much easier to deploy tracking code without editing your website’s core files every time.
- Configure GA4 event tracking. With Tag Manager in place, you can create triggers for specific actions — like a form confirmation page loading, or a phone number link being clicked — and send those events to GA4 as named conversion actions.
- Mark key events as conversions. Inside GA4, you then mark your most important events as official “conversions” so they’re elevated in your reporting and easy to track over time.
- Test everything. Use GA4’s DebugView and real-time reports to confirm that conversions are being recorded accurately before relying on the data for decisions.
Done well, this setup gives you a rich, reliable stream of conversion data flowing into your analytics account every single day.
The Problem With Raw Analytics Data
Here’s the honest truth: Google Analytics is incredibly powerful, but it’s also incredibly overwhelming for most business owners.
Log into a fresh GA4 account and you’ll be greeted by dozens of reports, hundreds of metrics, and charts that require real familiarity with analytics concepts to interpret correctly. Most business owners don’t want to become data analysts — they want to quickly understand whether their website and marketing efforts are working, and make decisions from there.
The goal isn’t more data. It’s the right data, presented clearly, when you need it.
That’s exactly the problem that Google Data Studio — Google’s free data visualization platform — was built to solve.
Google Data Studio: Your Custom Conversion Dashboard
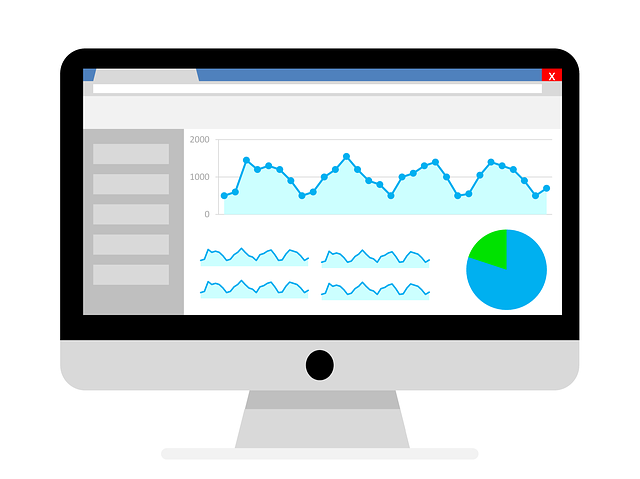
 Google Data Studio connects directly to your Google Analytics account and lets you build custom, shareable dashboards that display exactly the metrics you care about — nothing more, nothing less.
Think of it as the translation layer between raw analytics data and the clear, actionable information you need to run your business. Instead of digging through menus and reports inside GA4, you open your Google Data Studio dashboard and see your key numbers at a glance: how many leads came in this month, which channel drove the most conversions, whether this week is tracking ahead of or behind last week, and so on.
What Makes a Good Conversion Dashboard?
A great Google Data Studio dashboard isn’t just visually clean — it’s strategically designed around the decisions you actually need to make. Some of the components we typically build for clients include:
Date range controls that let you instantly compare this month to last month, this year to last year, or any custom time period you choose. Conversion summary cards for each key action — contact forms, calls, purchases — showing totals and trend percentages. Traffic source breakdowns that reveal which marketing channels (organic search, paid ads, social, email) are actually delivering results. Top-converting pages so you know which areas of your website are doing the heavy lifting. And device breakdowns because what works on desktop sometimes fails completely on mobile — and you need to know that.
Instead of logging into multiple platforms and exporting spreadsheets, a Google Data Studio dashboard gives you one clean URL you can bookmark, share with your team, or even embed on a private page. Your data is always live and up to date — no manual refreshing required.
From Data to Decisions: Real-World Examples
Let’s bring this to life with a few examples of how conversion data translates into real business decisions.
A home services company notices their phone click conversions spike dramatically on Monday mornings. Armed with that insight, they shift their Google Ads budget to run more aggressively at the start of the week — and their cost-per-lead drops by 22%.
A local retail shop with an e-commerce component sees that their Facebook ads are driving plenty of traffic but almost no completed purchases. Digging into the data, they discover visitors from Facebook are bouncing at the cart page. They test a simplified checkout experience targeted at mobile users, and sales conversions double within a month.
A professional services firm uses their dashboard to present ROI reports to their own leadership team. Instead of vague claims about “online presence,” they can show exactly how many qualified leads the website generated each quarter and which marketing investments produced them.
If you’re running Google Ads, there’s an added bonus worth mentioning: when GA4 conversion events are linked to your Google Ads account, the ad platform can use that real conversion data to automatically optimize your campaigns — showing your ads more often to people who are likely to convert, not just click. This alone can significantly improve campaign performance over time.
The Setup Is an Investment That Pays for Itself
 It’s worth being straightforward about one thing: setting up conversion tracking properly does require some upfront work. Configuring Google Tag Manager, defining and testing conversion events in GA4, and then designing a meaningful Google Data Studio dashboard takes time and technical know-how. Done sloppily, tracking can be inaccurate — and bad data is almost worse than no data, because it leads you to wrong conclusions with false confidence.
But done right, it’s one of the highest-leverage investments a business can make in its online presence. The insights you gain don’t just help you spend smarter on advertising — they inform your website design, your content strategy, your service offerings, and your overall understanding of how customers find and choose your business.
And once the infrastructure is in place, the dashboard runs itself. You spend five minutes a week glancing at your numbers instead of hours trying to pull together reports from disconnected sources.
Ready to See What Your Website Is Actually Doing?
At Page Progressive, we set up conversion tracking and custom analytics dashboards for our clients as part of our broader web strategy and marketing services. Whether you’re starting from scratch with no analytics in place, or you have GA4 installed but aren’t sure it’s capturing the right data, we can help you build a system that gives you clear visibility into what’s working — and what isn’t.
A properly configured dashboard doesn’t just report on the past. It becomes a living tool that guides your marketing, validates your investments, and helps you make confident decisions about where to put your energy and budget next.
Interested in setting up conversion tracking and a custom dashboard for your website? Reach out to the Page Progressive team — we’d love to help.